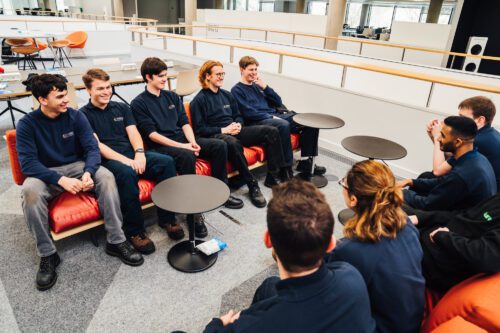
I work in the data team, which has two teams of three within it. I like working in a team because I learn so much. The guys I work with have been doing it such a long time and they give me lots of tips and ideas on how to present the data.
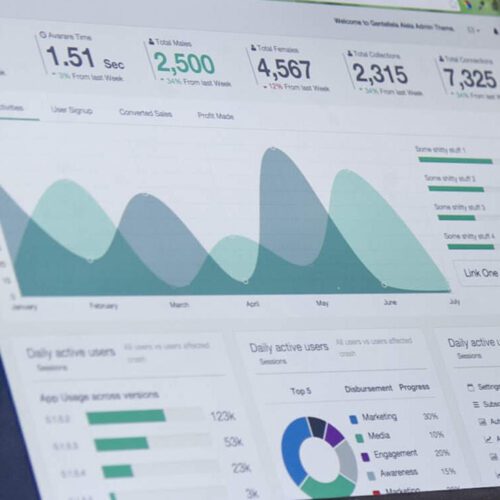
I use data to create visualisations and insights which help us build reports and presentations. The teams who manage events and income generation for the NSPCC come to us and request information on the results of campaigns, such as how many people signed up, where they are based and what the gender split was, and we find and present that data, often in bar charts or Venn diagrams.


